Remove dust from a legacy project


Years go by, platform code grows, browser platform support changes, and there you are: +300 Kilobytes of minified JavaScript code is shipped, same in CSS and the Chrome Code Coverage Tool shouts a huge blob of unused code in your face… Your legacy project collected dust along the way!
In this post I blog about
- how to analyze your codebasis
- types of unused code
- starting points to reduce unused code
- other tweaks to slim your codebasis
- how to measure your single javascripts and see which one is a refactoring candidate
Analyze your project with Chrome Code Coverage Tool
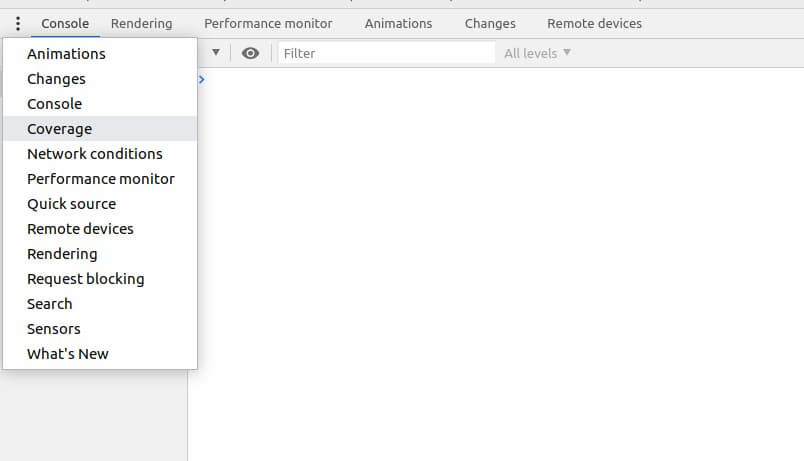
Open Chrome, open Devtools, in the console toolbar click the ⋮ (vertical dots) and choose Coverage:
Visit your site and run this tool over every important pagetype. Your results may look like this:
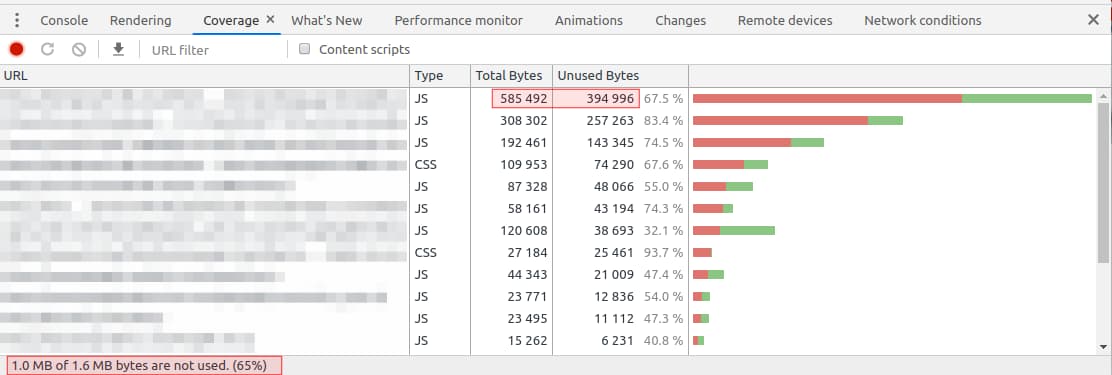
This list shows your code, as well as 3rd party code, it is the big picture. At the bottom line it shows how much code the browser downloaded, unzipped, parsed and did not use. In this example around 65%, nearly two of three characters in your CSS or JS are not needed.
Now take a look at your code, use the URL filter function above and make sure your domain and your Content Delivery Network (CDN) URLs are in your filterset.

And do not forget to take a look at your own URL:
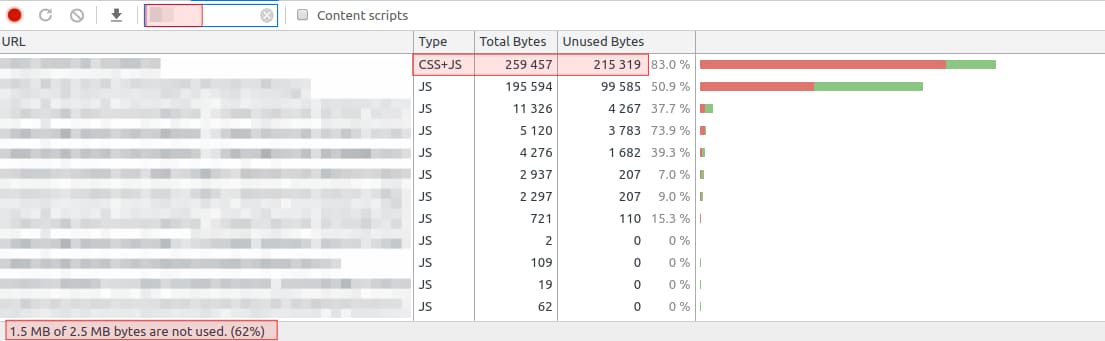
I am sorry - but these are real world project data, so I have to anonymize this data. And second sorry - I do not get it figured out, to use two URLs in this URL filter field. And to confuse you totally the first two figures and the last one are from different URLs. Same project, but different page types. I wanted to point out, that you can see your inline CSS+JS too with Chrome Coverage.
Unused Code - what is it, where it come from
Always remember, this is Chromes perspective on your code and Chrome is kind of a know-it-all browser today. Chances are high that Chrome did not use code other browsers do use.
unused code #1: http 1.1 best practice
Some time ago (in http/1.1 age) the best practice for good pagespeed was to reduce the amount of requests at all costs. So you bundled every JavaScript into one production bundle, minifiy this bundle and gzip/zopfli/brotli it before you send it to a browser.
In this bundle everything for the whole website was packed. A slider which is used on pagetype x, as well as a accordion from pagetype y and a tooltip library used on pagetype z…
Using this bundle for your whole project leads into unused code, because you include all website code that bundle, but every pagetype uses only a part of it. I wrote a little more detailed about this topic in my Lazy Scripts post.
Besides the huge filesize your browser needs to uncrompress, parse and execute all this scripts before he know what he do not need. On mobile devices this is a huge impact.
With http/2 multiplexing this is not necessary anymore, many requests to one http/2 endpoint are not expensive anymore. Over night, bundling scripts has become an anti-performance-pattern.
Unbundle all your scripts and put them only into pages where they are needed, but keep them minified and compressed.
unused code #2: polyfills
By using modern web features like `picture element` (for webp) and `intersection observer` (for lazy loading) or `NodeList.prototype.forEach`, a polyfill comes handy for these features. Chrome download these polyfills, parse them and ignore it, cause Chrome supports all this native, like most modern browsers do.
If your browser support has changed over time, like from IE >= 9 to IE >= 11, it is worth to check every polyfill if it is still needed, to check if a smaller variant is available and check if not a whole polyfill bundle is used (eg babel-polyfill).
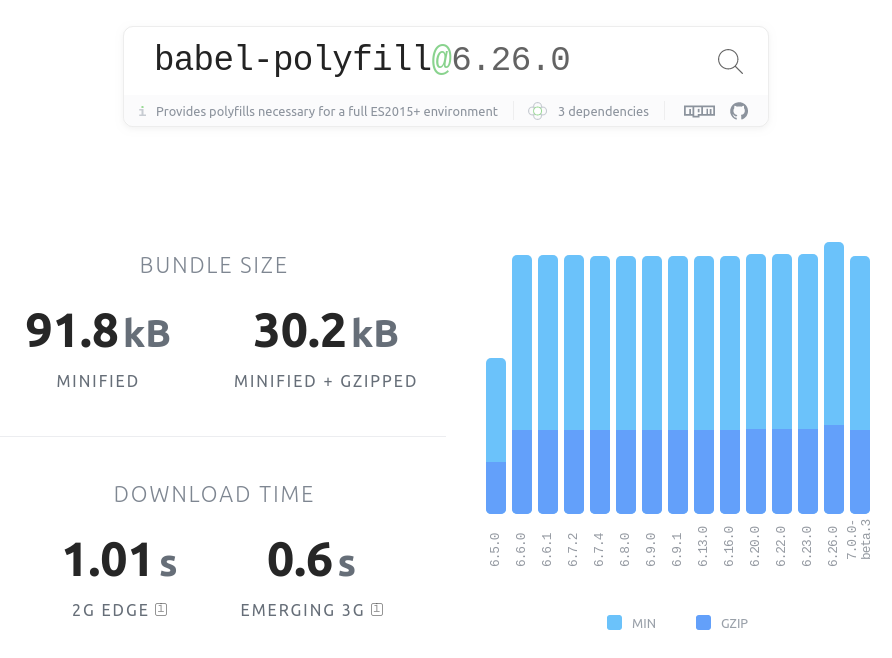
During development it may happen that a complete polyfill bundle lands in your platform code, and analyse what really is used of this bundle is an exhausting task.
Sometimes you need to be bold and remember good old progressive enhancement times. The <picture> element might not bring the benefit on IE 11, but without polyfilling IE 11 will display the <img> within the <picture> element. I think your IE 11 visitor prefer less javascript execution time and is fine with the default image.
unused code #3: 3rd party libraries
Look in your code and check all third party components and libraries/frameworks your project is using. This task will have the biggest impact on your code, you might reduce huge parts of unsued code but it will not be easy.
A good example is moment - the javascript date library:
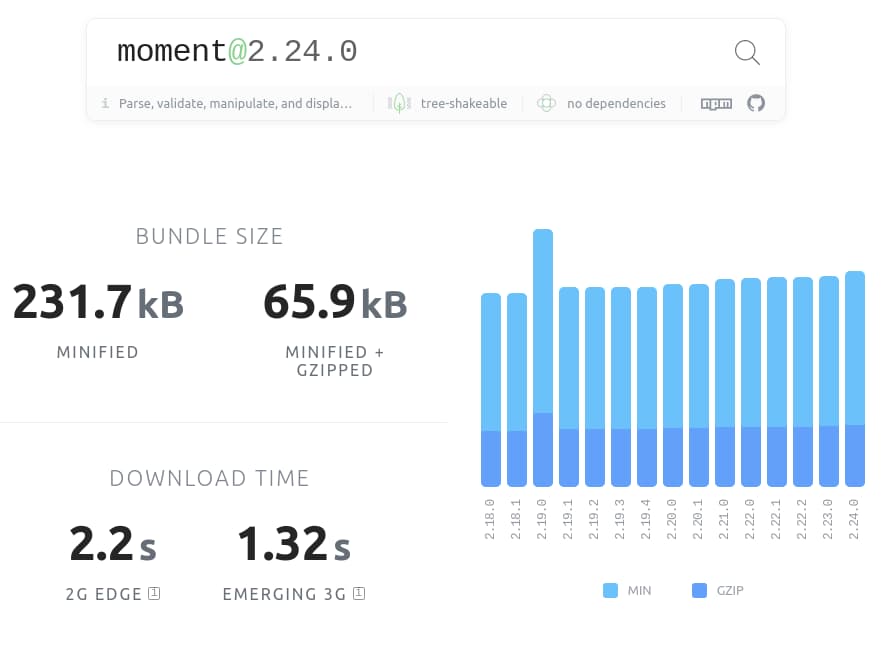
I know, often a `npm install moment --save` is done quickly and your date manipulation works fine. But at this stage of code optimization we have left the easy path.
Browser through your code and search for all usages of moment and see if you can achieve same results with plain js.
If you search the web for native implementations of your moment usecase you will be surprised what is possible these days. But if you see your code makes heavy usage of moment, it might not be worth to exclude moment. As always it depends…
Rule of thumb: If you stumble upon a huge utility library it is worth to take a deep dive in your code and see how it is used and if you can replace your usage with native code.
Another example is a slider library. Maybe you use swiper in your project:
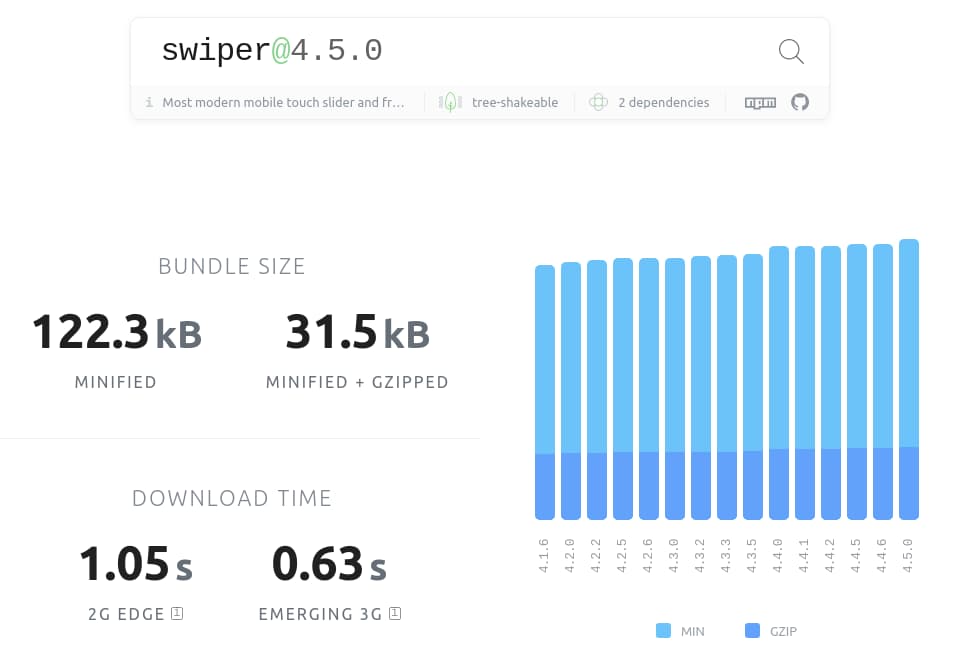
and you search for alternatives, I choose a very lightweight slider script called glider.js:
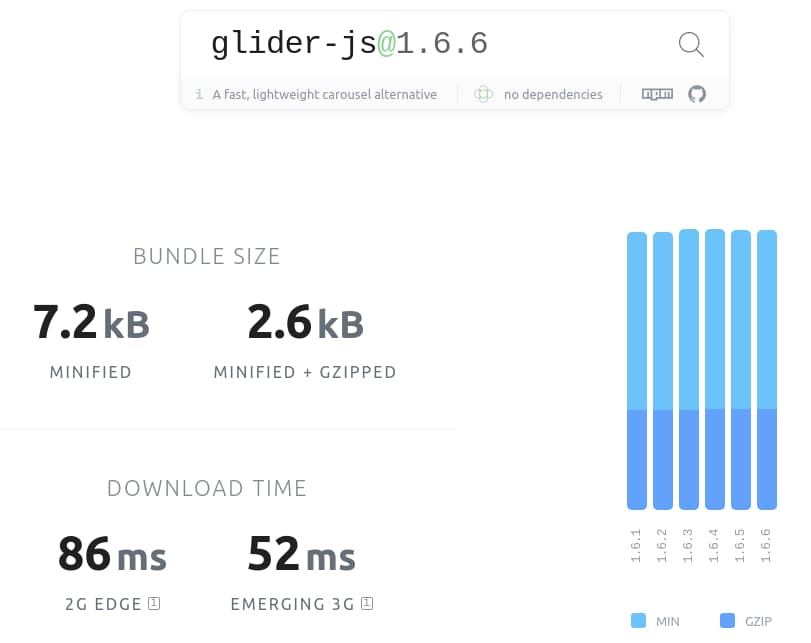
I think glider.js is not a 100% feature complete alternative to swiper, I just want to show that it is worth to look for alternatives. If you use slick-slider oder owl carousel keep in mind that this library needs jQuery to run:
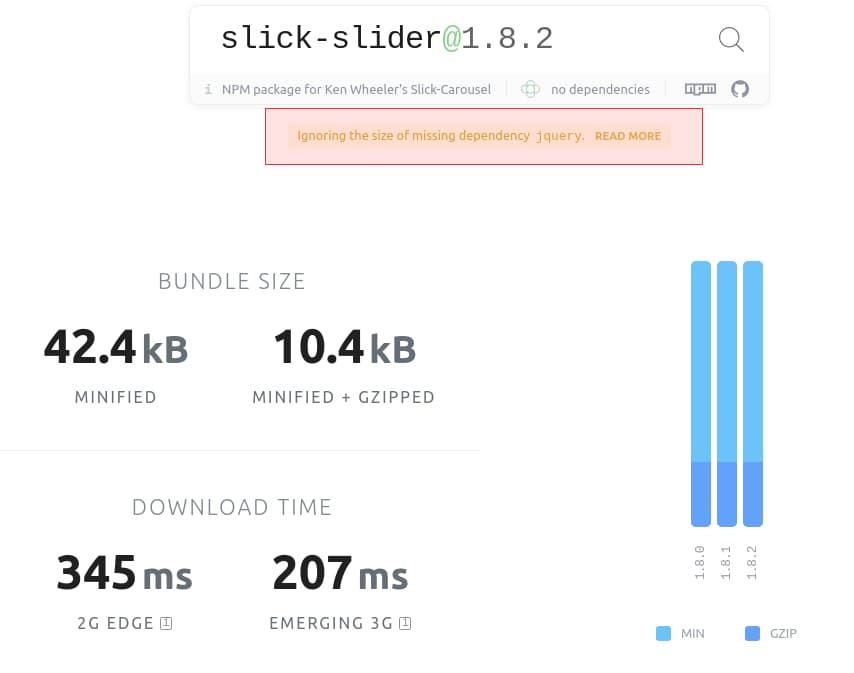
Sometimes bundlephobia shows a hint, for third party dependencies, which might blow up your javascript bundle. Switching to a dependency free library can have a huge result in your bundle size.
Always try to get rid of those dependencies, perhaps you think
"I can not get rid of libx, it is used everywhere and from everythird"
and step by step every library is standalone and replaceable.
unused code #4: inlined js
Putting javascript functions in your page is a good thing for feature detection (eg. webp support), and often it is used to provide translations etc. Both scenarios are legit. When you need some javacript be run before the browser starts to paint something, put it in the <head> before your CSS, that's fine.
If you provide a big translation object (datepicker, form validation, etc.) that's fine too. Just check that it is only embedded when the component is used, and not on every page.
In many scenarios your html comes with a no-cache header, so everything you put in there, will always be downloaded fresh.
Other inlined code should be evaluated if it is really needed as inline, and if it can run right before </body>.
Remember: inline js immediatly stops browsers render process and will be executed. If this code is not really important, put it in a file and async or defer it.
If you have a large amount of unused inline javascript, check what it is. polyfills are not needed inline, but feature detection is.
unused code #5: beyond the fold
Chroms Code Coverage list is always a snapshot, what Chrome used for the screen you look at. When you start to scroll or use a complex component like a search box with ajax, the values of unsued code will change.
For First Meaningful Paint optimization, you might not need every code piece, that lay beyond the fold. You can try if lazy-scripts can help you here. Like image lazy loading, lazy scripts, can load and execute javascript when it's markup appears in viewport.
Let's do it
With Chromes Code Coverage Tool and bundlephobias metrics, you can start to remove some dust from your code base.
Clarify your supported browsers and than make a list what 3rd party libs are used and how tools depend on each other. Your result may look like this:
| package | used version | actual version | minified | gzip | ext deps | int deps |
|---|---|---|---|---|---|---|
| jquery | 3.3.1 | 3.4.1 | 84.5 kB | 29.6 kB | none | ajax, events, selector, animate |
| moment | 2.22.0 | 2.24.0 | 231.7 kB | 65.9 kB | daterangepicker | moduleX, moduleY |
| daterangepicker | 3.0.3 | 3.0.3 | 339.1 kB | 100.5 kB | moment,bootstrap,jquery | moduleZ,moduleX |
| bootstrap | 3.4.1 | 3.4.7 | 38.7 kB | 10.5 kB | jquery | moduleB, moduleF… |
| … | ||||||
| picturefill | 3.0.3 | 3.0.3 | 11.3 kB | 4.9 kB | none | IE 11 |
| intersection-observer | 0.5.1 | 0.6.8 | 6.8 kB | 2.4 kB | none | IE 11 |
| @babel-polyfill | 7.4.3 | 7.6.4 | 85.4 kB | 28.5 kB | none | IE 11 |
With this list you can see, what code needs what code and how costly it might be replacing/removing this. First you should check if you can wipe out every external dependency, and than you can see if you can replace libs with a newer/smaller one, or with some plain js code.
Summary
Using Chromes Code Coverage tool gives you a good starting point to renew your code basis. Most benefits are possible if you started your project years ago with different browser support, and than with an updated browser support list.
Bundlephobia is a great tool to measure your used packages, often you do not know where your payload come from.
Switching to http2 and debundling all your js files, enables you to only ship files within a page, that are used on this page.
Bonus Level - debundled code analysis
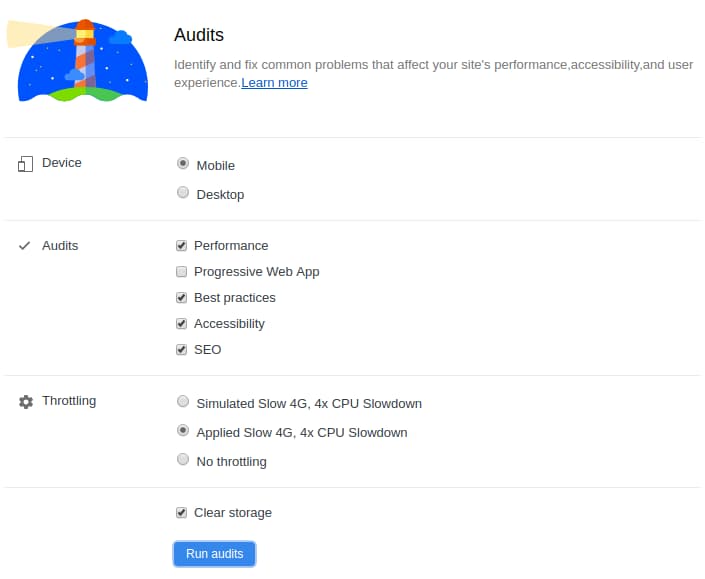
After all steps from above, your code is shipped as single-concern javascript files. Now you are able to make a Lighthouse audit and in your results you will see what script of yours takes how long and may be a good refactoring opportunity:
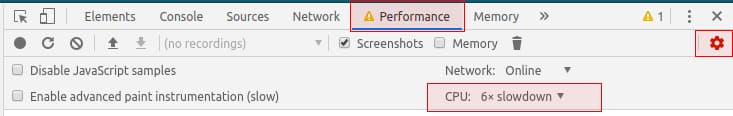
To get a good perspective on how good your js perform, active a 6x CPU slowdown in chrome devtools, before you start the lighthouse audit. Usually a dev notebook has a lot of power, you better try to throttle your cpu as much as you can to see which of your scripts has a lack of performance.
With the 6x CPU slowdown in the performance tab, choose Applied Slow 4G, 4x CPU Slowdown, or Simulated Slow 4G, for this task download speed is not that important, but a slow downed CPU is.

With this CPU slowdown settings javascript execution times look dramatic - but remember a mid range mobile phone might have this CPU speed.
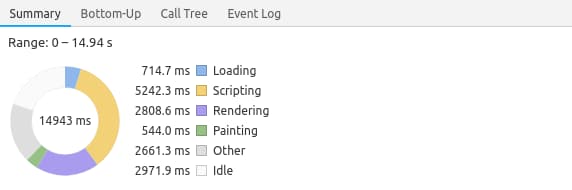
The screenshot above is taken via chrome devtools remote device and a real nexus 4. No slowdown, just open the Performance tab and reload the page with performance recording.
Back to topic - with the list above you can see how your code performs and see where a refactor will result in a better First CPU idle.
Thanks for reading - I hope I could encourage you to dust-wipe your legacy project too. It is possible and your visitors will thank you - and so your customer.
Article Image from Austin Ban via unsplash and ghost.